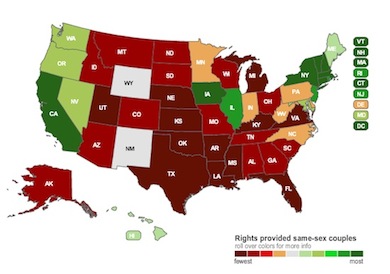
We mentioned a recent Pew Research Center survey earlier this week (in Naked News) that shows how public acceptance of same-sex marriage has grown in the past two years, jumping by 9 percentage points, making the country now evenly divided on the issue, with 46% in support legalization and 44% opposed. While reading up on the topic, we found two interesting infographics on the topic, both of which show the progress that’s been made in the gay rights movement.
First, there’s the LA Times’ interactive map (above) which shows you milestones in the fight over gay rights and how laws have changed in all 50 states since 2000. Hit the “play” button in the lower left hand corner for a quick review; hit the “view milestones, by month” for a slower, more detailed description of what’s gone down, when.
Then there’s…


